


 Islands")


")


")


")


")
")


 Germany
 Japan
Japan
 United Kingdom
 China
China
Assay Kits | ELISA | IHC | Antibody Conjugation
OriGene brings its powerful reagent systems to create new single and multiplexed immunoassays, antibody pairs,ELISA reagents and custom assay development.
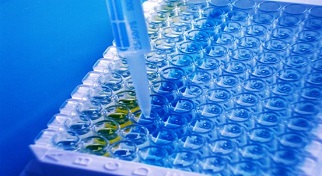
ELISA antibody pairs
Selected and developed from OriGene’s extensive TrueMAB® antibody collection, OriGene’s ELISA antibodies undergo a multi-step validation process that optimizes antibody performance to generate great results for your ELISA application.
Conjugation Kits
Simple, stable, scalable conjugation kits. OriGene conjugation kits utilize a novel chemistry to generate highly reproducible conjugates with a simple procedure. The resulting conjugates have been shown to be extremely stable, retaining nearly 100% activity after storage for 2 months at 37ºC.
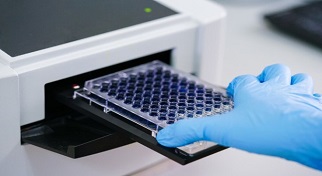
ELISA Kits
OriGene offers hundreds of ELISA kits in immunometric assay formats. These kits allow specific, quantitative measurements of disease-related proteins, including cytokines, chemokines and signaling targets.
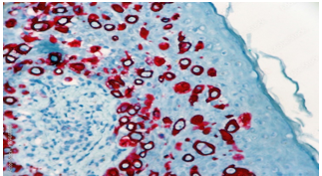
IHC Kits & Reagents
OriGene is proud to distribute the high-quality Immunohistochemistry (IHC) reagents. Your one stop shop for all IHC needs.
OriGene’s Resources for Immunoassay Development Include:
- 38,000 full-length expression clones
- TrueMAB®monoclonal antibodies
- 10,000 full length human proteins
- 18,000 over-expression lysates
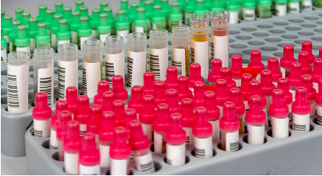
- 140,000 tissue samples